Using a spreadsheet to derive calibration factors
Note: templates for the techniques discussed in this recipe are attached above. Both Microsoft Excel Macro Enabled Worksheet and LibreOffice Open Document Spreadsheet formats are available. These templates can be used to record a full calibration history for our instruments.
Spreadsheet software such as Microsoft Excel, LibreOffice Calc or OpenOffice Calc are a convenient means for deriving calibration factors. The main advantage is that the method can be made independent of any operator decision, so that all users given the same raw material would produce the same answer.
What we ourselves do is described below, using as an example a calibration carried out on our own pressuremeter.
Figure 28-1 shows the numbers obtained for arm 1:
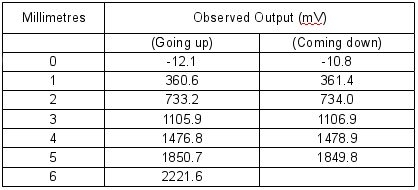
Figure 28-1 Observed output values for Arm 1
These numbers together with the following formulae were then typed into the rows and columns of a spreadsheet as shown in Figure 28-2:
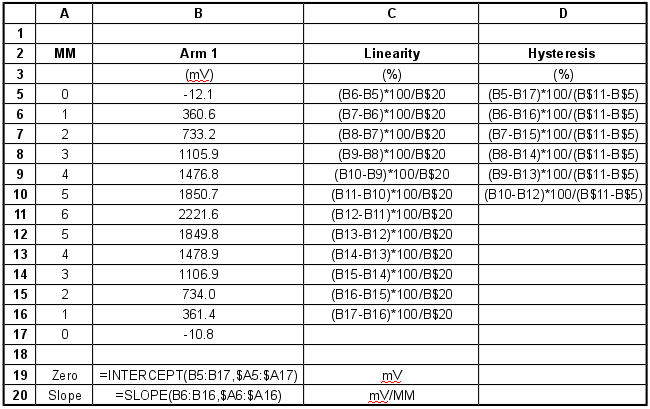
Figure 28-2 Data and formulae as entered into spreadsheet
The INTERCEPT and SLOPE formulae in cells B19 and B20 utilise linear regression analysis. Column A provides the fixed x-axis component and column B the variable y-axis component. The INTERCEPT function returns the value in millivolts where the regression line intercepts the y-axis. The SLOPE returns the gradient of the regression line in millivolts per millimetre.
The formulae and values from the above cells produced a display as shown in Figure 28-3:
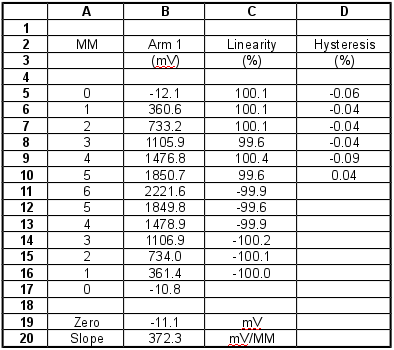
Figure 28-3 Output of spreadsheet after calculation of calibration factors
Using the facilities of the spreadsheet these data can be plotted to give a graphical representation. However it is easy to see that in this example the graph will merely show a straight line with no apparent hysteresis.
Similar formulae and procedures can be applied to all transducers.